|
WSPRnet
CHARTING OVERVIEW - WEB DATA IMPORT
Step by
step guide for exporting WSPRnet data to Microsoft Excel for
charting from a web site.
HOME >
OPERATIONAL
>REFERENCES >WSPR
CHARTING >
Graphing a 24 hour history of WSPR pings
from the WSPRnet database. This example is of the 630m band for a 24
hour period on the 22 August 2017.

Open WSPRnet web
page: http://wsprnet.org/drupal/
and click ‘Database’
upper right of the WSPRnet screen.

The database will
appear then click link ‘Link to old
database interface’

The old database
will appear then then populate the Database Query fields and click
‘Update’

Open Microsoft
Excel, click the ‘DATA’ tab,
then double click ‘From Web’ above.

The
address will automatically populate the Address with the WSPRnet
query URL as above or copy or paste the URL if not.
Click
‘Import’

Note: At this point
by clicking 'Options / Save Query’ the entire import process can be saved as
a *.igy
file and the Query can
simply be run again.

Click ‘OK’

The Text is now
imported into Microsoft Excel however may require some tiding up.

Create four
additional column as indicated ‘B’.
Click the ‘DATA’ tab, then
Click on the ‘A’ column and
then click the ‘Text to Columns’
tab.

In the Text to
Column Wizard Click ‘Fixed width’
radio button as above.

Create a break line
as above and click ‘Finish’.

The WSPR data
fields should now be displayed in Microsoft Excel as above with the
date and time in separate columns.

Graphing; with the
mouse select column ‘B’ (UTC Time) then while pressing the Ctrl
key select column ‘E’ (Signal to Noise Ratio or SNR) as
above.
Or instead of
selecting whole column select with the mouse only the data fields of
interest by the same technique.

Click the INSERT
tab in the upper left of the Microsoft Excel screen and then select
the Scatter Chart as above.

Displayed is a chart showing in the
vertical column the SNR and in the horizontal row, the UTC time. The
time column needs to be cleaned up to look more meaningful. Double
click the horizontal time row and a box marked AXIS
OPTIONS – TEXT OPTIONS will appear as below.
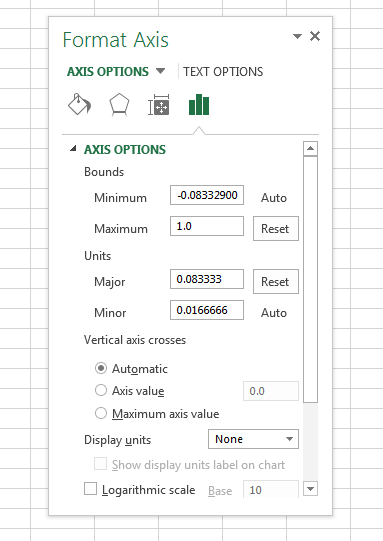
Change the Maximum to 1.0 and the
Units / Major to 0.0833333 as above.

The result is a
chart showing 24 hours of UTC time in the horizontal and the SNR
(Signal to Noise Ration) in the vertical column for station traffic
as recorded by VK6YSF for 22 August 2017.
Note
the drop in SNR from approximately 13:30UCT, that is VK4YB reducing
his transmission power from 5.0W (+37dBm) to 0.5W (+27dBm)
References
For
more information on import web data to Microsoft Excel. See:
https://support.office.com/en-us/article/Get-external-data-from-a-Web-page-708f2249-9569-4ff9-a8a4-7ee5f1b1cfba
TOP
OF PAGE
Page initiated 09
December, 2017
Page
last revised 05 November, 2025
|